Once you’ve added a component and it’s been live for awhile, it’s likely that you’ll want to see how its performing.
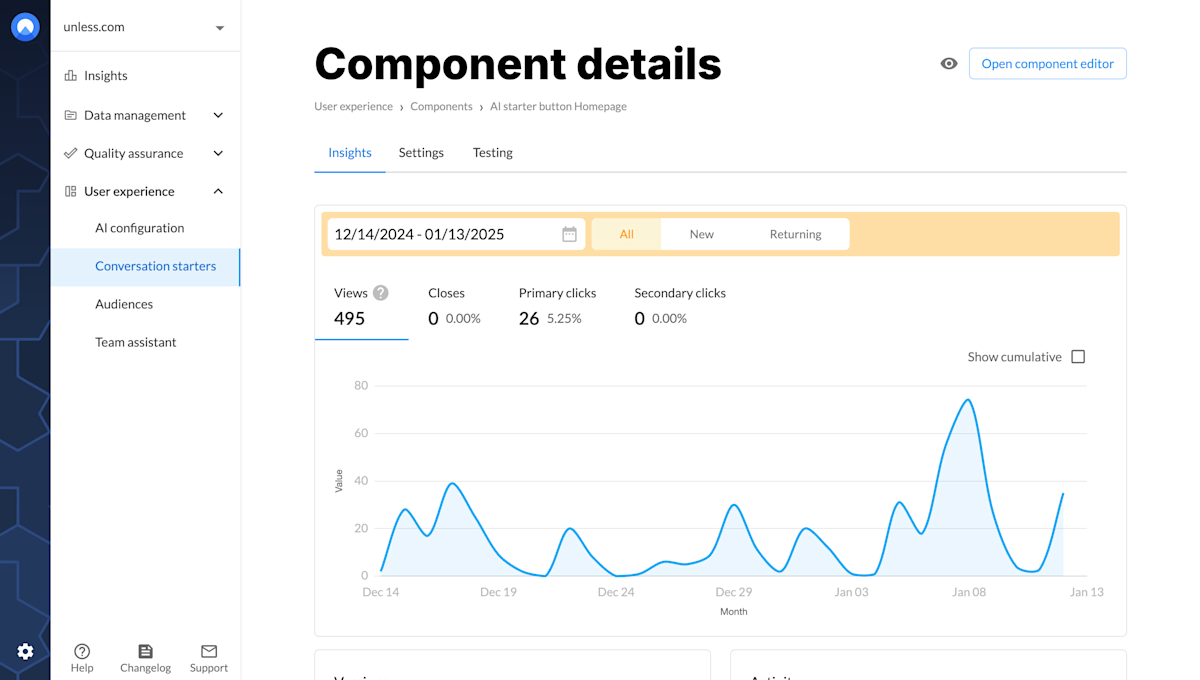
At the components tab, you can click on the component you’d like to see insights for which will bring you to the view below.
Here you can select a date range for which you’d like to see insights as well as if you’d like to see the numbers for all, new, or returning visitors. You can click around and see statistics for how many views a component got, how many times it was closed, and how many primary and secondary clicks were received.

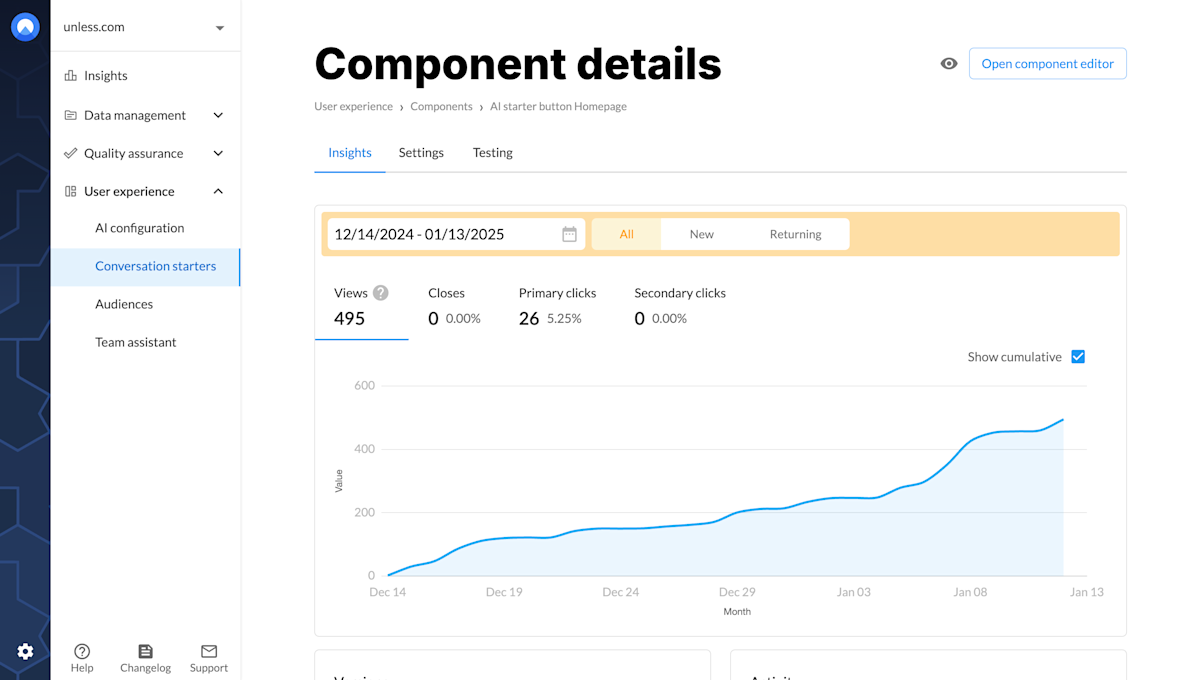
You can also check the cumulative box to see numbers added up over time instead of per day. An example of this can be seen below.

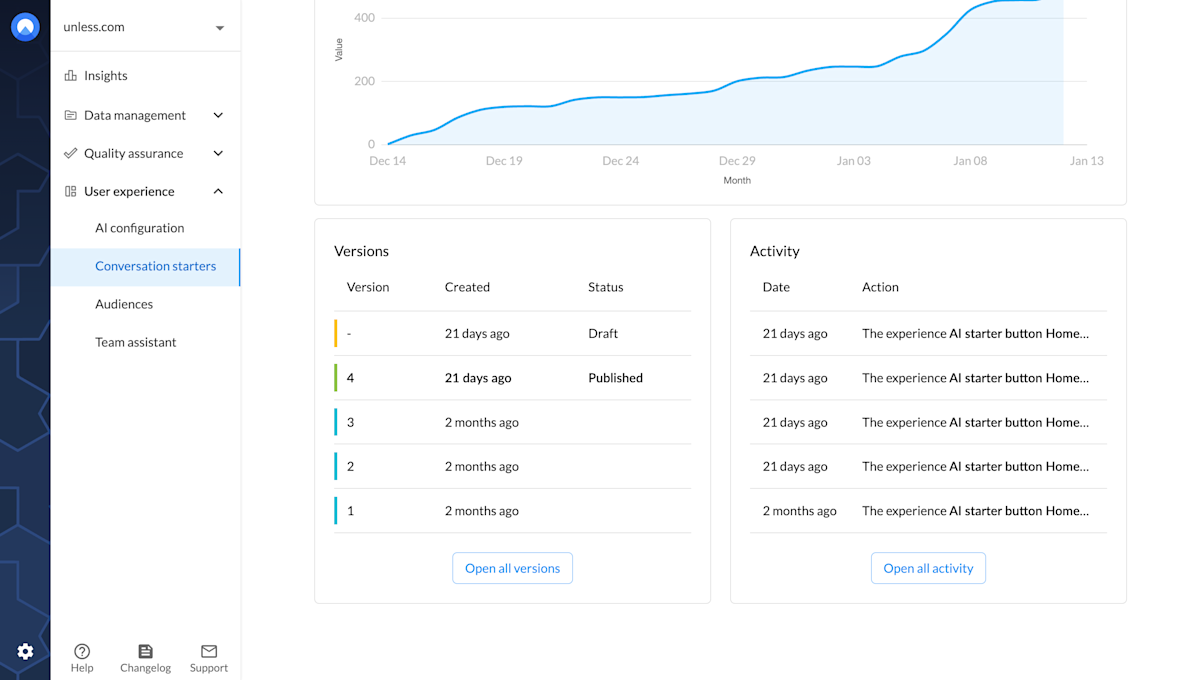
If you scroll down the page, you can see the version history of your component on the left, where you can see older versions of the component and revert to them if necessary. On the right is an activity log that enables you to keep track of what changes were made, when, and by who.


